
The 2006 RAW Survey
Survey Forum
Discuss the 2006 RAW Survey results in the Survey Forum.

The 2006 RAW Survey - Chapter 5
Chapter 5. Preferences among Camera Features in a Hypothetical Camera Purchase Decision
As demonstrated in Chapters 2 through 4, the distributions of answers to many questions posed in the 2006 RAW Survey questionnaire repeatedly demonstrated that a majority of photographers and imaging professionals believe that a common, openly documented standard for RAW image files would be beneficial to their photography – both now and in the future. At the time of the survey, however, no camera manufacturer had indicated support for this perspective, and none had brought to market a professional grade camera that met these preferences.
Results presented in Chapter 4 showed that nearly three-fourths of respondents indicated they would consider purchasing "a professional grade camera that created RAW files in an open, standard format," and that nearly half of this group would even consider switching camera brands from their current models for that purpose. We reasoned, however, that the capability to write RAW files in an open, standard format would be only one of many camera features that purchasers would evaluate when making a decision to buy a new camera system. Part III of the 2006 RAW Survey comprised a series of questions to investigate the relative importance of a variety of performance features and other characteristics that photographers would be likely to consider when making a purchase decision.
Ratings of Factors that May Affect Camera Purchase Decisions
The introduction to this section (reproduced in Table 8 below) presented three hypothetical new camera models labeled "Brand A," "Brand B," and "Brand C," and provided brief descriptions of performance features on a set of 10 dimensions, including:
- Form Factor: 35mm SLR form vs. medium format
- Sensor Size: the dimensions of the imaging sensor expressed in millimeters
- Image Size: the size of the image files expressed in megapixels
- Color Depth: the number of bits per channel of color data
- Focal length multiplier: the focal length or field of view factor compared to 35mm standards
- Frame Rate: the number of images recorded per second
- Sensitivity: the sensitivity of the imaging chip expressed in ISO values for "noiseless" images
- New lenses available: the number of new lenses that would take advantage of all camera features
- Image Quality Index: a fictional new rating of overall image quality expressed on a 100-point scale
- RAW Technology: whether RAW image files are written in proprietary vs. open, standard format
Each of the three hypothetical "brands" was given a unique combination of the 10 factors that might be typical of the product differentiation typically encountered in high-end photographic systems.
Table 8. Description of Hypothetical New Camera Models
| We are interested in your preferences about what camera manufacturers should offer in next generations of professional grade cameras.
Imagine that it is now the year 2008 and you are preparing to make a sizeable investment in the latest digital imaging technology. Three major manufacturers have exceptional new products, including camera bodies, lenses, and flash units. System prices have become very competitive, so price is no longer a deciding factor. The technology for matching sensors to lens performance has advanced so much that whichever brand you buy, you will need a new set of lenses to match the new body - whether or not you stay with your current brand or switch to another. After doing extensive research on the specifications provided by manufacturers, reviewing reports by independent testing labs, and consulting other resources you trust, you have determined that you have the following choices: |
||||||||||||||||||||
| Brand | Technical Features | RAW Technology | ||||||||||||||||||
|---|---|---|---|---|---|---|---|---|---|---|---|---|---|---|---|---|---|---|---|---|
| A |
|
|
||||||||||||||||||
| B |
|
|
||||||||||||||||||
| C |
|
|
||||||||||||||||||
| * Image Quality Index is a fictional new independent rating that evaluates 10 dimensions of image quality resulting in a composite score on a 100-point scale. | ||||||||||||||||||||
Following the description of the three "brands," survey question #11 presented respondents with the following task: "You have decided to buy one of these three camera systems. Using a scale from 1 to 10 where 1 means "Not at all important" and 10 means "Extremely important", please rate the following ten factors in terms of their importance in making your purchase decision."
Chart 21 below displays the distribution of responses for all 10 factors.
Chart 21. Respondents’ Ratings of the Importance of Ten Factors for Making a Hypothetical Camera Purchase Decision

Because fewer than 30% of respondents gave rating scores of 1 through 6 to seven of the 10 factors, those respondents were grouped together into a single category ("1 through 6") in the bars of Chart 21. Response values of 7, 8, 9, and "Extremely important" are shown separately. Also, the order of the factors shown in Chart 21 was changed from the order presented in the questionnaire. In Chart 21, the dimension with the smallest percentage choosing "extremely important" is at the top, and dimension with the largest percentage indicating "extremely important" is at the bottom.
About half the respondents gave relatively low importance rankings to two factors – "frame rate" (52%) and "focal length multiplier" (48%). Only 8% indicated that "frame rate" was "extremely important," and only 13% gave the highest rating to "focal length multiplier."
The next four items in Chart 21 show relatively similar response distributions. Between 26% and 35% gave scores of 1 through 6 to "image size" (26%), "new lenses available" (28%), "form factor" (35%), and "sensor size" (27%). Between 31% and 38% of respondents rated these four factors with scores of "9" or "extremely important," with between 19% and 22% rating all four as "extremely important."
The next three factors in Chart 21, "sensitivity," "color depth," and "RAW technology," also showed similar patterns. Few respondents gave these factors scores in the 1 to 6 range – 13% for "sensitivity," 15% for "color depth," and 17% for "Raw technology." Moreover, about half of respondents – 50% for "sensitivity," 48% for "color depth," and 53% for "RAW technology" – gave all three dimensions scores of "9" or "extremely important," with 27% to 32% rating all three factors as "extremely important."
Among the ten factors, Image Quality Index (IQI) stood out from the others. This factor received by far the fewest ratings in the 1 to 6 range (only 9%), and was the factor that the largest percentage of respondents considered to be highly important – with 63% giving IQI ratings of "9" or "extremely important," and 37% rating this dimension as "extremely important."
In summary, Chart 22 below shows the average rating scores given to each of the 10 dimensions. The "frame rate" factor received the lowest average rating (approximately 6 on a 10-point scale), while Image Quality Index received the highest average rating, over 8.6 on the 10-point scale. Three of the 10 factors have average rating scores between 6 and 7, three dimensions have average scores between 7 and 8, and four factors have mean ratings between 8 and 9 on the 10-point scale.
Chart 22. Average (mean) Importance Ratings Given by Respondents to Ten Factors for Making a Hypothetical Camera Purchase Decision
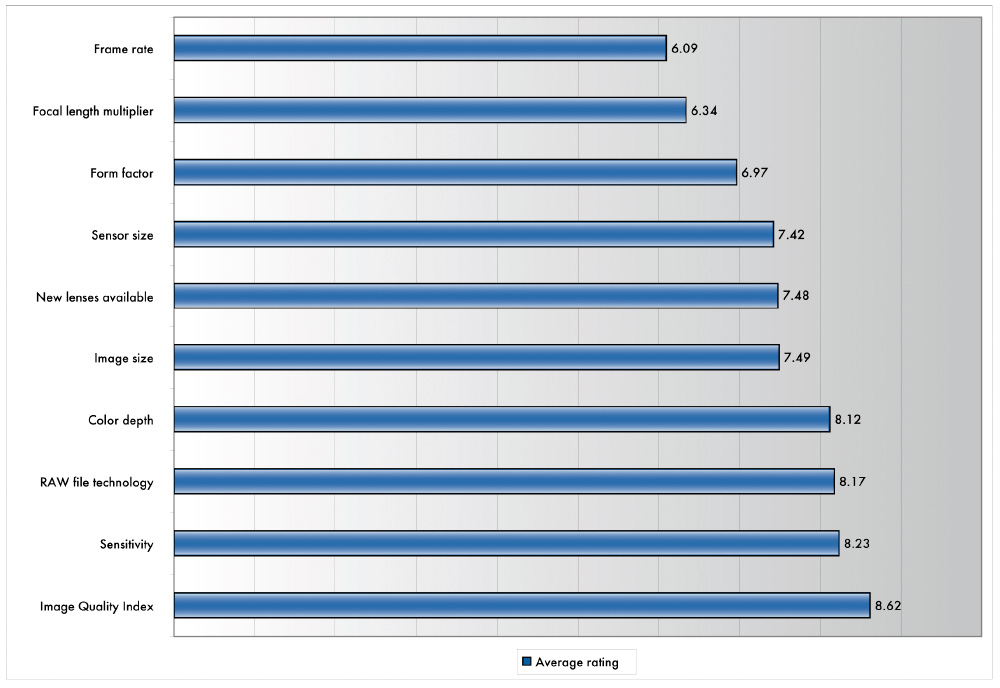
Table 9 below shows that the relative order of importance as indicated by the average rating score is roughly the same for all six types of photographers and imaging professionals. For most (but not all) of the factors, average ratings given by professional photographers are slightly higher than those given by other categories, but the differences are relatively small.
Table 9. Average (mean) Importance Ratings Given by Respondents to Ten Factors for Making a Hypothetical Camera Purchase Decision for Six Categories of Photography Users
| Overall | Full time professional | Part time professional | Graphic arts professional | Technical photography user | Dedicated amateur | Hobbyist | |
| Frame rate | 6.09 | 6.34 | 6.39 | 5.97 | 5.57 | 5.99 | 5.86 |
| Focal length multiplier | 6.34 | 6.71 | 6.40 | 6.52 | 6.22 | 6.24 | 6.15 |
| Form factor | 6.97 | 7.17 | 7.06 | 6.91 | 6.76 | 6.94 | 6.70 |
| Sensor size | 7.42 | 7.97 | 7.55 | 7.58 | 7.39 | 7.26 | 7.10 |
| New lenses available | 7.48 | 7.64 | 7.56 | 7.30 | 7.32 | 7.47 | 7.31 |
| Image size | 7.49 | 8.49 | 7.89 | 7.69 | 7.35 | 7.19 | 6.69 |
| Color depth | 8.12 | 8.63 | 8.42 | 8.29 | 8.10 | 7.96 | 7.54 |
| RAW file technology | 8.17 | 8.71 | 8.26 | 8.21 | 8.20 | 8.05 | 7.78 |
| Sensitivity | 8.23 | 8.24 | 8.34 | 8.34 | 8.07 | 8.20 | 8.15 |
| Image Quality Index | 8.62 | 8.87 | 8.82 | 8.64 | 8.53 | 8.54 | 8.28 |
Following the item on importance ratings for the 10 factors, survey question #12 asked respondents to indicate which of the three imaginary brands they decided to "purchase." Chart 23 displays the results.
Chart 23. Respondents’ Purchase Decisions among Three Hypothetical New Camera Models
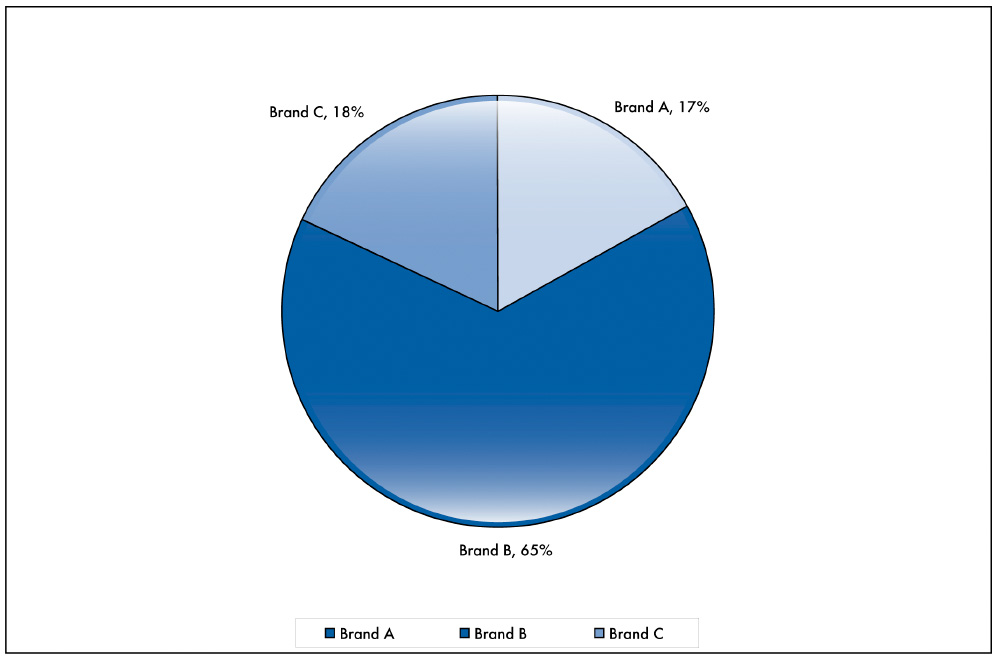
Nearly two-thirds of respondents (65%) indicated a preference for Brand B. Considerably smaller, and nearly identical fractions chose Brand A (17%) and Brand C (18%).
The next question asked respondents to identify which of the 10 factors (discussed above) they considered "the most important reason for your choice." Table 10 below shows the response distributions for respondents who chose each of the hypothetical camera models. Not surprisingly, the factors considered "most important" for the hypothetical purchase decision differed considerably for respondents who "bought" each of the three models.
Table 10. Camera Feature Identified as the Most Important Reason for Respondents’ Choices among Hypothetical New Camera Models
| Camera Feature | Brand A | Brand B | Brand C |
| Form factor | 9% | 6% | 4% |
| Sensor size | 36% | 5% | 19% |
| Image size | 6% | 7% | 12% |
| Color depth | 2% | 2% | 6% |
| Focal length multiplier | 5% | 1% | 1% |
| Frame rate | 1% | 3% | 0% |
| Sensitivity | 5% | 22% | 1% |
| New lenses available | 1% | 6% | 0% |
| Image Quality Index | 29% | 10% | 54% |
| RAW image technology | 6% | 38% | 4% |
| Total | 100% | 100% | 100% |
For the 17% who selected Brand A, the "sensor size" (24x36mm or "full-frame 35mm equivalent) was identified as most important by over one-third (36%). "Image Quality Index" score was the factor named next most often by purchasers of Brand A, with 29% indicating this factor led all others. These two factors were named by nearly two-thirds (65%) of those who preferred Brand A over the other two models. Relatively small percentages (between 1% and 9%) named any of the other eight features as "most important" for their decision.
Among the 18% who preferred Brand C, three features were named as "most important" by at least 10% of these respondents. "Image Quality Index" was overwhelmingly the most frequently cited feature, named by 54% of respondents who preferred Brand C (which was described as having the highest IQI score of the three hypothetical models). Another 19% of this group named "sensor size" as most important (Brand C was the only model of the three to have a sensor measuring 80mm by 80mm). Finally, "image size" (88 megapixels) was considered "most important" by 12% of those choosing Brand C. Together, these three factors were named by 85% of those who preferred Brand C. The other seven features were named as "most important" by 0% to 6% of this group.
A strikingly different preference pattern was reported by 65% of respondents who chose Brand B. Three factors were named as "most important" to the hypothetical purchase decision – "RAW image technology" by 38%, "sensitivity" by 22%, and "Image Quality Index" by 10%. A total of 70% of Brand B "purchasers" named these three factors as "most important." The other seven features were named by only 1% to 7% of those who preferred Brand B.
When a photographer decides to purchase a camera system, there are typically two sides to the evaluation of available options. The first, and perhaps most important, we call "attractors" – the features of a camera system that are considered desirable for their ability to enable photographers to achieve their goals. The second, also important facet of the decision, we term "repellers" – the aspects of a system that are viewed as problematic because they are perceived as obstacles to achieving the purchasers’ goals. To explore the second aspect of the hypothetical purchase decision, respondents were asked to identify which of the 10 camera features was the most important reason that they chose not to "purchase" each of the two camera models that they rejected. Tables 11, 12, and 13 show the factors identified by respondents as the most important reasons for their decision to reject the two brands they did not select.
Table 11 shows the distribution of factors cited as the reason for rejecting Brand A by those who preferred Brands B and C. There were four factors – "Raw image technology," "Image Quality Index," "image size," and "sensor size," named by the 18% who preferred Brand C as their most important reasons for rejecting Brand A. However, for the 65% of respondents who chose Brand B, there was only one key factor – the "Raw imaging technology" that was described as a "completely proprietary RAW file format." The description of the RAW technology for Brand A included several features designed to ensure that Brand A buyers would have difficulty using RAW conversion/editing software other than that provided by the manufacturer of Brand A.
Table 11. Main Reason for Rejecting Brand A among Respondents Who Decided To Purchase Brand B or Brand C
| Brand Purchased | ||
| Brand B | Brand C | |
| Form factor | 3% | 4% |
| Sensor size | 4% | 10% |
| Image size | 5% | 11% |
| Color depth | 1% | 3% |
| Focal length multiplier | 2% | 2% |
| Frame rate | 1% | 1% |
| Sensitivity | 6% | 1% |
| New lenses available | 3% | 1% |
| Image Quality Index | 2% | 21% |
| RAW image technology | 75% | 46% |
| Total | 100% | 100% |
Table 12 displays the percentages who cited each of the 10 factors for rejecting Brand B by the 17% of respondents who preferred Brand A and the 18% who chose Brand C. Four factors were cited by Brand A "purchasers" for their rejection of Brand B, with the two most important being "sensor size" and "Image Quality Index." "Focal length multiplier" and "RAW imaging technology" were cited by about one tenth of those who preferred Brand A. These factors were, indeed, clearly differentiated between the two brands.
Table 12. Main Reason for Rejecting Brand B among Respondents Who Decided To Purchase Brand A or Brand C
| Brand Purchased | ||
| Brand A | Brand C | |
| Form factor | 5% | 4% |
| Sensor size | 38% | 26% |
| Image size | 7% | 8% |
| Color depth | 1% | 3% |
| Focal length multiplier | 11% | 7% |
| Frame rate | 2% | 1% |
| Sensitivity | 1% | 1% |
| New lenses available | 2% | 0% |
| Image Quality Index | 24% | 45% |
| RAW image technology | 10% | 6% |
| Total | 100% | 100% |
For the 18% who preferred Brand C, two factors predominated. Nearly one half of these respondents (45%) rejected Brand B for its inferior "Image Quality Index" score, while one-quarter (26%) rejected Brand B because of its smaller sensor size.
The primary reasons for rejecting Brand C by respondents who chose to "purchase" Brands A and B are shown in Table 13. For respondents who favored either Brand A or Brand B, the medium "format factor" was the "most important" reason cited most frequently for rejecting Brand C. A modest percentage of those who favored Brand A also rejected Brand C because of the large "image size" (17%) and the large "sensor size" (12%).
Among the 65% of respondents who chose Brand B, the second most frequently cited reason for rejecting Brand C was its RAW image technology (25%). In addition, 10% of Brand B "purchasers" rejected Brand C for its large "image size."
Table 13. Main Reason for Rejecting Brand C among Respondents Who Decided To Purchase Brand A or Brand B
| Brand Purchased | ||
| Brand A | Brand B | |
| Form factor | 45% | 41% |
| Sensor size | 12% | 6% |
| Image size | 17% | 10% |
| Color depth | 0% | 0% |
| Focal length multiplier | 2% | 1% |
| Frame rate | 5% | 4% |
| Sensitivity | 3% | 7% |
| New lenses available | 5% | 5% |
| Image Quality Index | 2% | 1% |
| RAW image technology | 9% | 25% |
| Total | 100% | 100% |
Possible Implications of the Preference of Survey Respondents for Hypothetical "Brand B"
The largest percentage of respondents who preferred Brand B in the hypothetical purchase decision indicated that their choice was influenced by Brand B’s "RAW image technology." As shown in Table 8, the RAW imaging technology for Brand B included the following features:
- Open RAW file format
- Documentation to be provided to the public (including independent software developers) at no cost
- Brand B does not offer RAW conversion or editing software
This approach to implementing RAW imaging technology in a camera system was cited as the most important basis for a hypothetical purchase decision more often than any other factor for any of the three cameras. This may be seen in Table 14, which displays the absolute percentage of respondents who named each factor as most important for all three camera preferences. Table 10 showed percentages among groups of camera "purchasers," so that each column added to 100%. Table 14 differs from Table 10 by showing the complete distribution of respondents across the 30 table cells (three camera models by ten factors), with the percentages of the 30 cells summing to 100% (as shown in the right-most column).
Table 14. Percent of All Respondents who Identified Each of Ten Camera Features as the Most Important Reason for Choosing among Hypothetical New Camera Models
| Brand A | Brand B | Brand C | Total | |
|---|---|---|---|---|
| Form factor | 2% | 4% | 1% | 6% |
| Sensor size | 6% | 3% | 3% | 12% |
| Image size | 1% | 4% | 2% | 7% |
| Color depth | 0% | 1% | 1% | 3% |
| Focal length multiplier | 1% | 1% | 0% | 2% |
| Frame rate | 0% | 2% | 0% | 2% |
| Sensitivity | 1% | 15% | 0% | 16% |
| New lenses available | 0% | 4% | 0% | 4% |
| Image Quality Index | 5% | 7% | 10% | 21% |
| RAW image technology | 1% | 25% | 1% | 27% |
| Total | 17% | 65% | 18% | 100% |
Table 14 shows that, given the three specific hypothetical camera models offered, all of which had features superior to any models for sale today, most respondents – 27% of 18,385 who answered all questions in this section of the survey – identified the incorporation of open, documented RAW imaging technology as the single factor that was most important to their purchase decision.
It should be noted clearly that 73% of survey respondents named one of the other 9 factors as more important to their decision about which hypothetical model to purchase. However, when combined with all other factors that prospective customers must consider to make a complex decision to purchase an expensive, high-end camera system, the RAW imaging technology factor clearly dominates all other individual features with respect to its potential impact on future purchases.
We hope it is clear to all readers that we are not claiming that our hypothetical example of camera system options is an accurate predictor of how camera buyers will behave in the future. We have no way to predict what camera makers will offer as new features of their flagship camera systems, what level of collaboration will evolve between camera makers and software developers, how well RAW conversion/editing software systems will be able to keep up with the continued evolution of RAW file technology developed by camera makers, and a host of other unknowns.
However, our hypothetical purchase scenario demonstrates that camera buyers can and do make careful comparisons among alternatives, are perfectly capable of weighing many differentiating factors in their evaluations of complex digital imaging systems, and are very clear and deliberate in their choices of the camera system features that will merit their financial investments.
We believe the results reported here should be considered carefully by camera makers and software producers as they continue to develop both the technologies and the marketing strategies for the new systems they offer to the next generation of prospective customers.