
The 2006 RAW Survey
Survey Forum
Discuss the 2006 RAW Survey results in the Survey Forum.

The 2006 RAW Survey - Chapter 1
Chapter 1. Who responded to the 2006 RAW Survey?
Between January 31 and March 15, 2006, a total of 19,207 photographers and others involved in creating and using digital images responded to the 2006 RAW Survey. Although the long survey period was allowed to ensure that all interested people would have an opportunity to contribute to the data set, most respondents completed the questionnaire in a much shorter time period. By the end of the third day after launch (February 2), 11,259 responses had been received – nearly 59% of the final total. By the time one week had elapsed (February 6), 14,965 individuals had responded (78% of the total received). Keeping the survey questionnaire available for five additional weeks allowed 4,242 additional participants to add their perspectives and experiences to the data base.
The Quality of the Response Data
The 2006 RAW Survey questionnaire was developed and tested over a period of two months. Over 150 photographers and imaging specialists volunteered their time to test and recommend improvements to early versions. The final Web-based questionnaire included 25 numbered items, but about half of the survey items included multiple questions or asked respondents to “check all that apply.” The result was that survey participants typically provided between 75 and 100 separate responses. Very few survey participants skipped over or declined to answer the survey questions. To provide a few typical examples:
- only 30 respondents (0.2%) did not answer Question #2 (“How often do you capture digital images in RAW mode?”);
- 595 respondents (3.1%) did not answer question #7 (“Which of the following RAW file conversion or editing software products do you use most often?”);
- 669 respondents (3.5%) did not answer question #12 (“Considering all ten factors, which camera system would you be most likely to purchase?”);
- 532 respondents (2.8%) did not answer question #21 (“What type of subject matter do you shoot most often?”);
- and only 437 respondents (2.8%) did not answer the final item (“Please indicate the area where you do most of your photography.”).
In fact, only 2 items in the entire questionnaire were missing responses from as much as 5% of the survey participants – questions that asked respondents’ views about which RAW conversion or editing software products provided the best image quality (question #8) and provided the best workflow (question #9). In summary, between 95% and 99.8% of the 19,207 survey participants answered each question, a remarkable result. The survey sponsors greatly appreciate the time and effort contributed by everyone who completed the questionnaire.
Characteristics of Survey Participants
Several of the questions in the 2006 RAW survey asked for information about respondents’ backgrounds and characteristics, such as:
- the best description of their involvement with photography now;
- the numbers of years involved in film photography, digital photography, using a professional-grade digital camera, and capturing digital images in RAW mode;
- the area where they do most of their photography;
- the number of images captured with a digital camera in an average month;
- the types of subject matter captured most often; and
- the brands of professional digital cameras used most often.
Our primary reason for including these questions was to be able to determine whether experiences and opinions about RAW imaging issues would vary across different types of respondents. However, answers to these questions also provide a broad overview of the characteristics of the people who responded to the survey.
This is especially important because it is not feasible to conduct a study like the 2006 RAW Survey with a true “random sample” of all photographers and others interested in RAW image technology. Because survey respondents volunteered to complete the questionnaire in response to announcements and press releases, we cannot claim that the respondents are “representative” of all photographers or imaging specialists because of our sampling methods.
However, the answers to the survey questions about background characteristics can help readers to make their own judgments about whether the survey results appear reasonable, or instead appear to represent the experiences, attitudes, beliefs, and preferences of 19,207 individuals who are – in some way – very different from typical, mainstream photographers and imaging professionals who use digital cameras to make their livings or pursue other creative visions or professional interests.
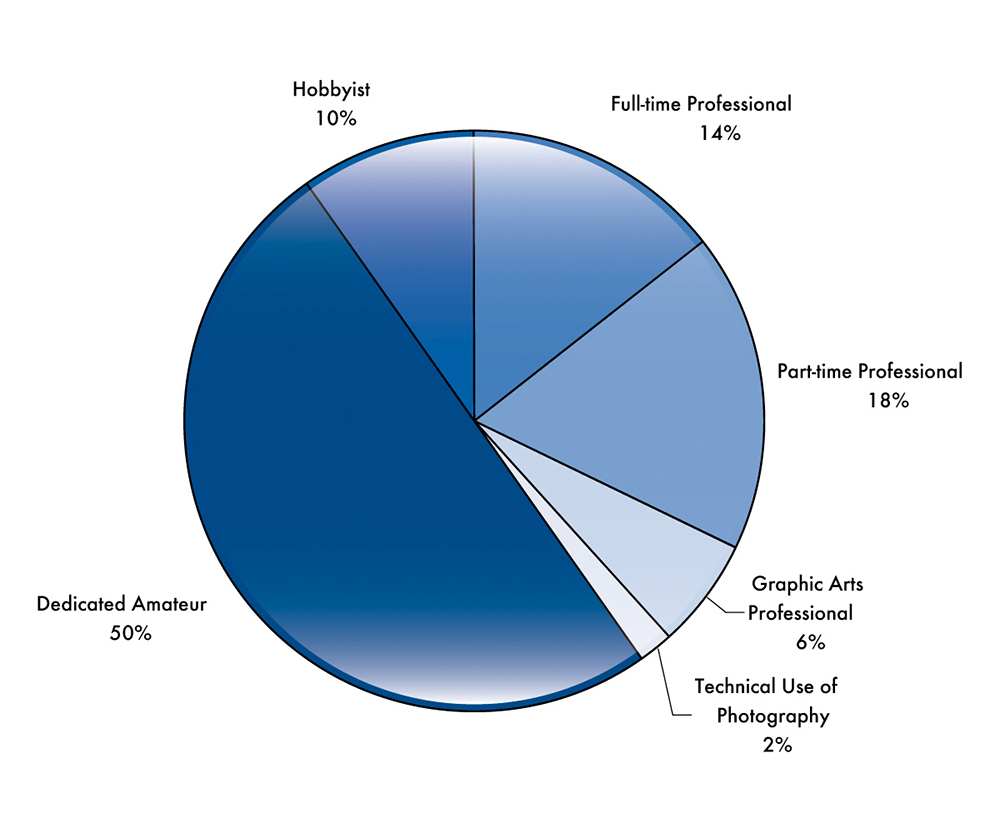
As shown in Chart 1 below, survey respondents comprised a mix of professional and amateur photographers as well as other types of users of RAW digital images. In response to Question 16, a total of 32% of respondents identified themselves as professional photographers (14% full-time and 18% part time). Another 6% reported they are professionals in the graphic arts that used RAW images, but were not themselves photographers. Only 2% of respondents indicated they used photography in support of other professions, such as science or medicine. Half (50%) of all survey respondents described themselves as dedicated amateurs, and 10% indicated that photography was a hobby.
Chart 1. Percentage Distribution for “Best Description
of Your Involvement with Photography Now”
Experience with film photography, digital photography, professional cameras, and shooting RAW
Overall, survey respondents reported having considerable experience with both film photography (average of 19.4 years) and digital photography (average of 4.5 years), using professional digital cameras (average of 3.7 years), and shooting in RAW mode (average of 2.3 years). Table 1 below shows the average (mean) number of years reported for each of these activities for each of the six categories of involvement with photography or digital imaging.
Table 1. Average (mean) Years of Experience Reported with
Film Photography, Digital Photography, Using a Professional-level Digital Camera,
and Shooting Images in RAW Mode
| Category | Film Photography |
Digital Photography |
Professional Digital Camera |
Shooting in RAW Mode |
|---|---|---|---|---|
| Full-time Professional |
20.7 | 5.5 | 5.5 | 3.1 |
| Part-time Professional |
19.6 | 4.7 | 4.3 | 2.5 |
| Graphic Arts Professional |
17.3 | 5.1 | 3.6 | 2.2 |
| Technical User of Photography |
23.7 | 5.7 | 4.4 | 2.7 |
| Dedicated Amateur |
19.8 | 4.3 | 3.1 | 2.0 |
| Hobbyist | 14.9 | 3.7 | 2.2 | 1.6 |
Area where respondents do most of their photography
Survey respondents lived and worked in all parts of the world. However, as shown in Chart 2, 89% of respondents reported working in North America (46%) and Europe (43%). Photographers and imaging professionals in Africa, Asia, Australia, and South America are thus considerably under-represented among respondents to the 2006 RAW Survey. Limiting the survey questionnaire to English only may explain the lower proportions of respondents from Africa, Asia, and South America. The numbers of respondents from Australia is consistent with the response pattern from Europe and North America.
Chart 2. Area Where Respondents Do Most of Their Photography

Chart 2 shows clearly that our survey participants include large numbers of respondents from Europe and North America, and include relatively few from the Africa, Asia, and South America. Does this make the survey results highly suspicious or even useless? The answer depends on whether photographers in Africa, Asia, and South America would have given significantly different answers to the survey questions than those given by their counterparts in Australia, Europe, and North America. Below, and throughout this report, we will show the responses to questions given by respondents from all six areas so that readers can judge whether the overall survey results we report might have been different if there were more participants from Africa, Asia, and South America.
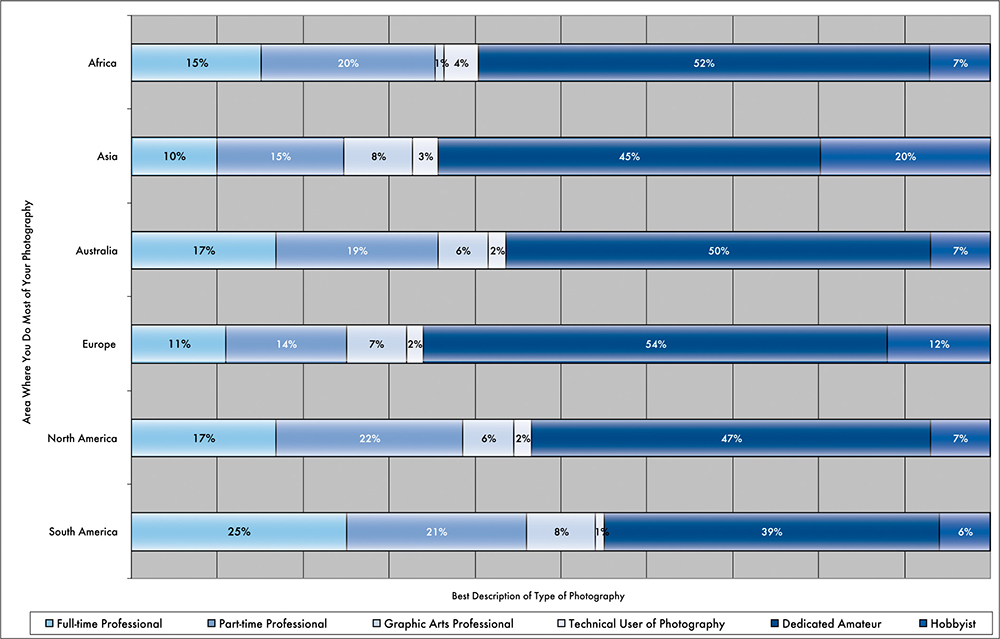
For example, Table 2 and Chart 3 show the percentages of respondents who classified themselves into the six professional and amateur categories within each of the six locations. The two professional categories comprised between 35% and 46% of the respondents from Africa, Australia, North America and South America, but made up only 25% of the respondents in Asia and Europe. Dedicated amateurs and hobbyists ranged from 45% to 59% in Africa, Australia, North America, and South America, but were 65-66% of the respondents in Asia and Europe.
Table 2. Best Description of Your Involvement with Photography
Now within Area Where You Do Most of Your Photography
| Category | Africa | Asia | Australia | Europe | North America | South America | All Areas |
|---|---|---|---|---|---|---|---|
| Full-time Professional |
15% | 10% | 17% | 11% | 17% | 25% | 14% |
| Part-time Professional |
20% | 15% | 19% | 14% | 22% | 21% | 18% |
| Graphic Arts Professional |
1% | 8% | 6% | 7% | 6% | 8% | 6% |
| Technical User of Photography |
4% | 3% | 2% | 2% | 2% | 1% | 2% |
| Dedicated Amateur |
52% | 45% | 50% | 54% | 47% | 39% | 50% |
| Hobbyist | 7% | 20% | 7% | 12% | 7% | 6% | 10% |
| Total | 100% | 100% | 100% | 100% | 100% | 100% | 100% |
Chart 3. Best Description of Type of Photography by Area Where You Do Most of Your Photography
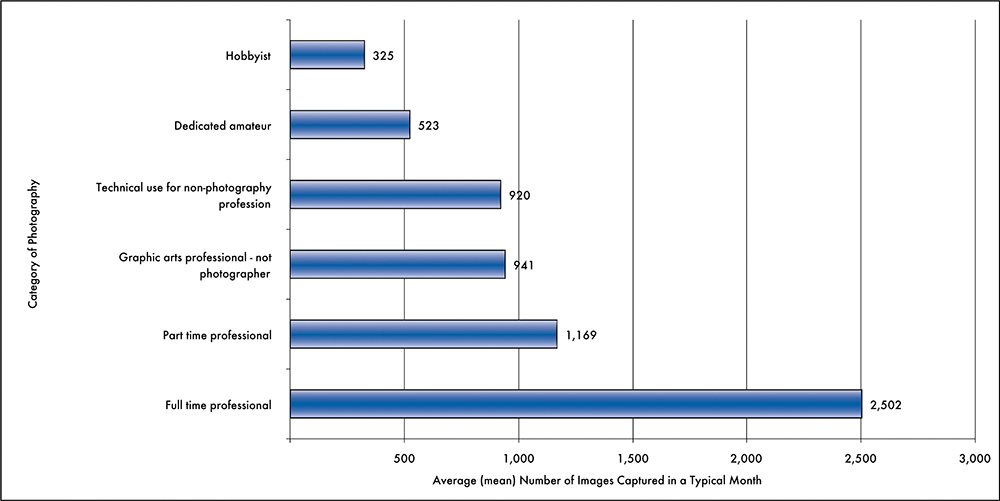
Average Number of Digital Images Captured in a Typical Month
The first survey question asked participants for an estimate of the number of images they captured with their digital camera in an average month . Respondents who indicated they were full-time professional photographers reported they captured an average of just over 2,500 digital images per month. Those who classified themselves as part-time professionals reported capturing an average of 1,169 digital images per month – only slightly more than the graphic arts professionals and those who use digital imaging for non-photography professions who reported averages of 941 and 920 images per month, respectively. The averages for the three latter groups were roughly double the average number of images reported by dedicated amateurs, and between three and four times the average reported by hobbyists.
Chart 4. Average Number of Images Captured per Month by Type of Involvement with Photography
By the time of the 2006 RAW survey, most respondents are likely to have created many thousands (in some cases many tens of thousands) of images in a variety of RAW formats. Our survey respondents are not passive observers of developments in RAW imaging technology – they have a great deal at stake in the ultimate outcome and are using their survey responses to express their views on issues that matter a great deal to them.
Types of Subject Matter Photographed
Survey respondents were asked to indicate the types of subject matter they photographed using a list of 14 broad categories. Over 18,700 respondents gave a total of 82,170 responses, indicating that, on average, respondents reported photographing between 4 and 5 different types of subjects. Chart 5 below shows that at least 25% of respondents reported that they photographed seven of the types of subject matter listed (fine art – 29%, architecture – 47%, wildlife – 47%, landscape/nature – 82%, portraits – 66%, weddings – 38%, and sports-related material – 25%).
Chart 5. Types of Subject Matter Photographed

When asked to indicate the single type of subject matter they photographed most often , 36% of respondents indicated landscape/nature material, followed by portraits (18%), weddings/events (8%), and wildlife (7%), with fine art, architecture, and sports at about 5% each.
Chart 6. Type of Subject Matter Photographed Most Often

The type of subject matter photographed most often differed significantly across self-reported category of photographer as shown in Table 3 below. Full-time professional photographers were most likely to report photographing commercial/advertising subjects (18%) as well as weddings/events (14%), portraits (12%), and news-related material (9%). Full-time professionals are significantly more likely than other categories to shoot commercial/advertising and news-related materials. Part-time professionals were most likely to report shooting landscapes/nature (23%), portraits (17%), weddings/events (14%), sports-related material (8%), and fine art (7%). Graphic arts professionals who are not photographers were most likely to report using landscape/nature subject matter (28%), portraits (17%), fine art materials (11%), architecture (9%), products, (6%) and commercial/advertising materials (6%). Those who use digital images in their non-photography professions were most likely to report photographic medical/scientific subject matter (32%), as well as landscapes/nature (20%), material for documentation or preservation (11%), and corporate/industrial subjects (7%). Dedicated amateurs and hobbyists reported very similar preferences, with nearly half of both groups reporting they most often photographed landscapes/nature (48-49%), portraits (20-25%), and wildlife (8-9%).
Table 3. Type of Subject Matter Photographed Most Often within Categories of Photographer
| Full time professional |
Part time professional |
Graphic arts professional - not photographer |
Technical use for non- photography profession |
Dedicated amateur |
Hobbyist | Total | |
|---|---|---|---|---|---|---|---|
| News- related |
9% | 4% | 2% | 1% | 1% | 0% | 3% |
| Sports- related |
5% | 8% | 2% | 2% | 4% | 3% | 5% |
| Weddings/ events |
14% | 14% | 5% | 1% | 5% | 7% | 8% |
| Portraits/ personal portfolios |
12% | 17% | 17% | 8% | 20% | 25% | 18% |
| Landscapes/ nature |
8% | 23% | 28% | 20% | 49% | 48% | 36% |
| Wildlife | 2% | 6% | 3% | 7% | 9% | 8% | 7% |
| Architecture | 5% | 3% | 9% | 6% | 4% | 4% | 4% |
| Documentary/ preservation |
3% | 4% | 5% | 11% | 3% | 2% | 3% |
| Fashion/ glamour |
4% | 4% | 2% | 1% | 1% | 0% | 2% |
| Products | 6% | 3% | 6% | 3% | 1% | 1% | 2% |
| Fine art | 5% | 7% | 11% | 2% | 4% | 1% | 5% |
| Commercial/ advertising |
18% | 3% | 6% | 1% | 0% | 0% | 4% |
| Corporate/ industrial |
7% | 2% | 2% | 7% | 0% | 0% | 2% |
| Medical/ scientific |
1% | 1% | 1% | 32% | 0% | 1% | 1% |
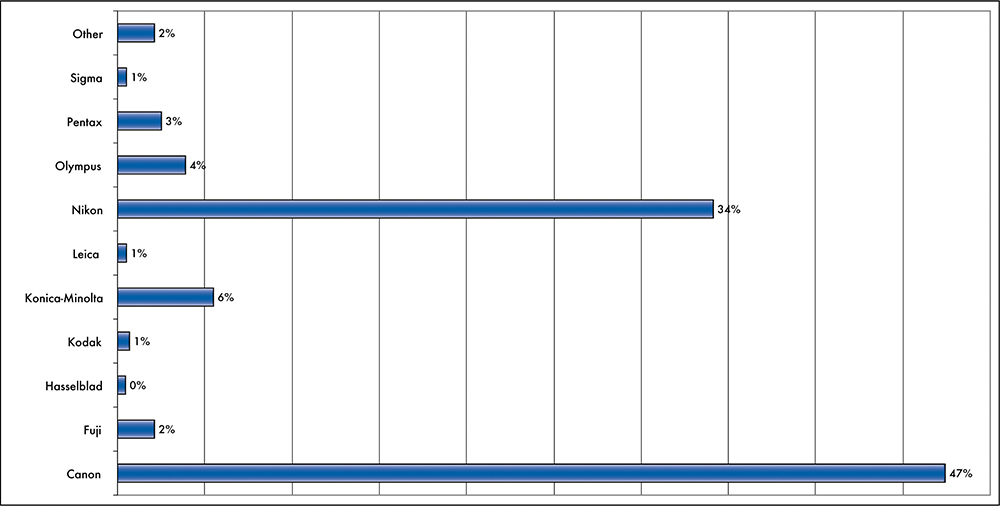
Brands of Professional Digital Camera Used
Survey respondents were asked what brand of professional digital camera they used most often. More than four in five (81%) reported using two major brands of digital SLR – Canon (47%) and Nikon (34%). Konica-Minolta ranked a distant third, with 6% claiming to use that brand most often. The other seven listed brands were reported by 1% to 4% of respondents. A total of 362 (2%) reported using “other” brands not listed among the response categories (e.g., Leaf, Sinar, Contax, Mamiya, Phase One, and a variety of others).
There were few differences from the preferences shown in Chart 7 across the six categories of photographers or imaging professionals. From 44% to 49% reported using Canon cameras most often, except for those using digital imaging for non-photography professions, where only 42 percent preferred Canon. Similarly, from 33% to 39% reported using Nikon cameras most often, except for hobbyists, where only 29% preferred Nikon.
Chart 7. Brand of Professional Digital Camera Used Most Often
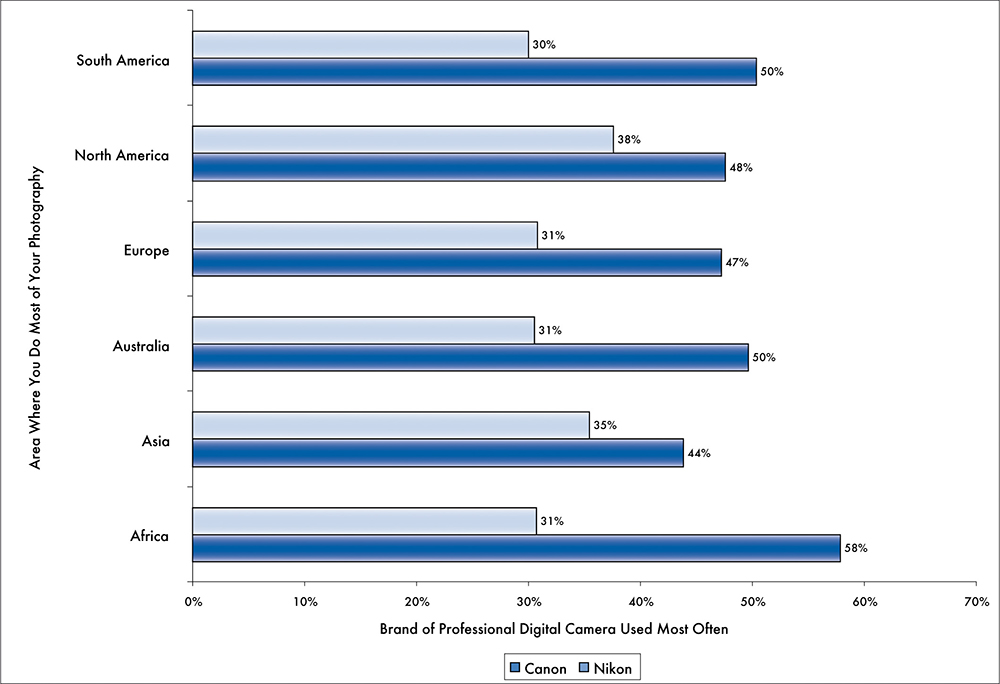
We compared the percentage that reported using the two most frequently named brands (Canon and Nikon) across the six continental areas; the results are shown in Chart 8. The percentages using each of the two brands are remarkably similar across areas, with the exception of Africa, where the preference for Canon is higher than in the other five areas. This difference may arise from the fact that the survey was completed by only 142 respondents who reported doing most of their photography in Africa. Small samples typically lead to greater variability in survey results.
Chart 8. Brand of Professional Digital Camera Used Most Often
by Area Where You Do Most of Your Photography
Frequency of Capturing Digital Images in RAW Mode
Question #2 in the survey asked: “How often do you capture digital images in RAW mode?” Chart 9 below displays the percentage of respondents who chose each of the five response categories.
Chart 9. Frequency that Respondents Capture Digital Images in RAW Mode
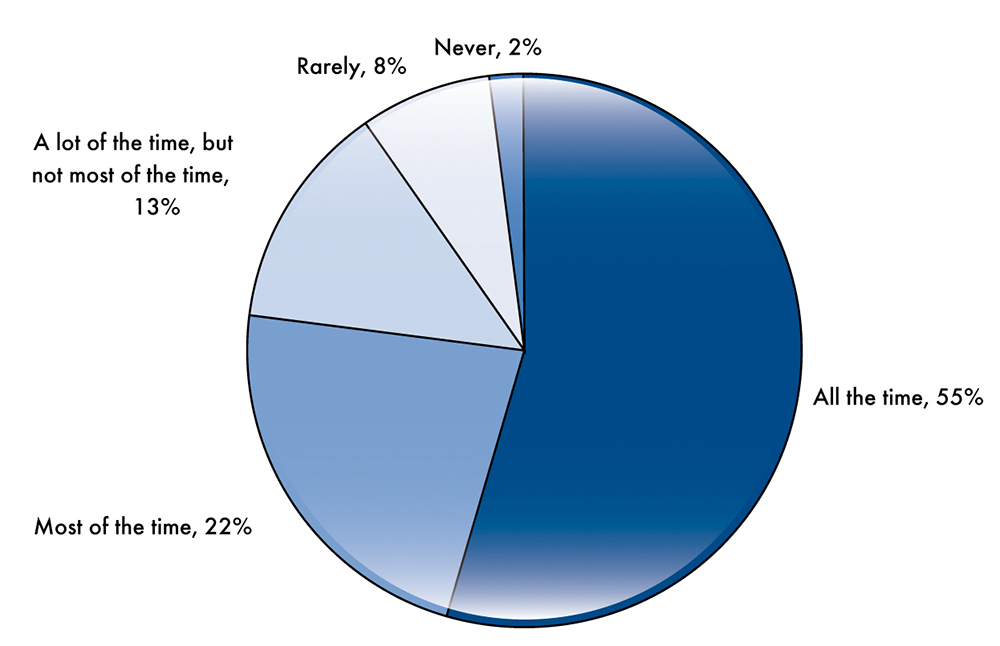
Over half of the respondents (55%) indicated that they captured images in RAW format “all the time.” An additional 22% reported that they used RAW mode “most of the time.” Thus nearly four in five respondents to the 2006 RAW Survey (77%) capture images in RAW format most or all of the time. There is little question that respondents to this survey have a great deal of experience with RAW image technology.
To confirm this, we examined the responses about the relative frequency of RAW mode shooting within five groups denoting the average number of digital images captured in a typical month and display the results in Table 4.
Table 4. Frequency of Shooting RAW Mode by Average Number of Images Captured per Month
| All the time | Most of the time | A lot of the time, but not most of the time |
Rarely | Never | Total | |
|---|---|---|---|---|---|---|
| 100 or fewer | 46% | 25% | 15% | 11% | 4% | 100% |
| 101 to 250 | 52% | 25% | 14% | 7% | 2% | 100% |
| 251 to 500 | 56% | 22% | 13% | 8% | 1% | 100% |
| 501 to 1,000 | 60% | 21% | 11% | 6% | 1% | 100% |
| More than 1,000 | 60% | 20% | 13% | 7% | 1% | 100% |
Table 4 shows that the differences in the relative frequency of shooting in RAW mode differ only slightly depending on the average number of digital images captured per month. About 80% of respondents in the two highest volume categories (“501 to 1,000” and “More than 1,000” images per month) reported shooting in RAW mode “all” or “most of the time.” Fully 60% of respondents in both these categories reported using RAW mode “all the time.” Only slightly less – 77% to 78% – of those who typically shoot lower volumes (“101 to 250” and “250 to 500” images per month) reported using RAW mode “all” or “most of the time.” Over half (52% to 56%) of the respondents in these two categories capture images in RAW format “all the time.” Even among the 3,905 respondents who reported shooting “100 or fewer” images per month, 71% indicated that they shoot in RAW mode “all” or “most of the time,” and almost half (46%) always use RAW mode.
Table 5 shows a similar breakdown of relative frequency of shooting in RAW mode by the six categories of photography or other imaging professional. The patterns are also similar to those in the breakdown on average shooting volume. Over 80% of both categories of professional photographers shoot in RAW format “most” or “all the time,” with about 60% using RAW mode “all the time.”
Table 5. Frequency of shooting RAW Mode by Type of Involvement with Photography
| All the time | Most of the time | A lot of the time, but not most of the time |
Rarely | Never | Total | |
|---|---|---|---|---|---|---|
| Hobbyist | 6% | 36% | 23% | 26% | 8% | 100% |
| Dedicated amateur | 56% | 22% | 13% | 8% | 2% | 100% |
| Technical use | 37% | 28% | 22% | 11% | 3% | 100% |
| Graphic arts professional | 47% | 25% | 18% | 9% | 1% | 100% |
| Part-time professional | 59% | 23% | 12% | 5% | 1% | 100% |
| Full time professional | 62% | 21% | 11% | 5% | 1% | 100% |
Between 65% and 78% of graphic arts professionals, those who use digital photography in other professions, and dedicated amateurs also shoot in RAW format “most” or “all the time.” Only in the category of hobbyists (containing 1,179 respondents) do we find that less than half reported shooting in RAW format “most” or “all the time.” Only 6% of this group reported shooting in RAW mode “all the time,” and over one-third (34%) indicated that they “rarely” or “never” used RAW mode.
These tables strongly support the conclusion that the vast majority of survey respondents have a great deal of experience with RAW imaging technology.
The additional analyses presented below demonstrate that respondents to the 2006 RAW Survey choose to shoot in RAW mode for a wide variety of reasons believed to support and improve the quality of the images they are able to produce. They are also aware of numerous problems and obstacles with using RAW technology and have a variety of perspectives concerning the potential impact of these problems and drawbacks and the best ways to deal with them.